



Entertainment on Demand (EoD) has been an industry leader in tracking the video streaming consumer lifecycle in the US since 2020. Expanding on that offer, EoD has launched a new Transactional service, tracking digital movie rentals and purchases, digital series purchases, and cinema sales alongside video streaming. It provides deep insights into the transactional category and connects titles from theatrical release to post theatrical viewing, whether streamed, rented, or purchased.
The following report looks at the state of the transactional industry in the US in the 6-month period of October 2025 through March 2026.
Post-Covid, transactional spend has struggled to recover to pre-Covid levels, particularly at the cinema. But as of March ’26, 1 in 3 Americans ages 16+ spent on transactional purchases in the past six months. The US transactional category was worth $5.7 billion in that time period.
Within transactional, the cinema is the largest category. 25% of Americans claim to have gone to the theaters to see a movie in the 6-month period. Movie-goers on average went to the cinema 4.1 times in that period, or roughly once every six weeks. Because of the high incidence of the category, the cinema accounts for 65% of all transactional spend in that period, followed by film rentals (15% of spend), film purchases (12% of spend), and TV show purchases (9% of spend).
Demographics play a large role in transactional behavior. Still sticking to movie-goers, there is a clear correlation between age and cinema frequency. Gen Z (under 24s) went to the movies the most frequently, on average 4.6 times in the 6 months from October to March. While Baby Boomers (ages 65+) went only 3.8 times on average. The outlier to this trend is the 25–34-year-old age group, which has a lower frequency of going to the movies, but a higher penetration.
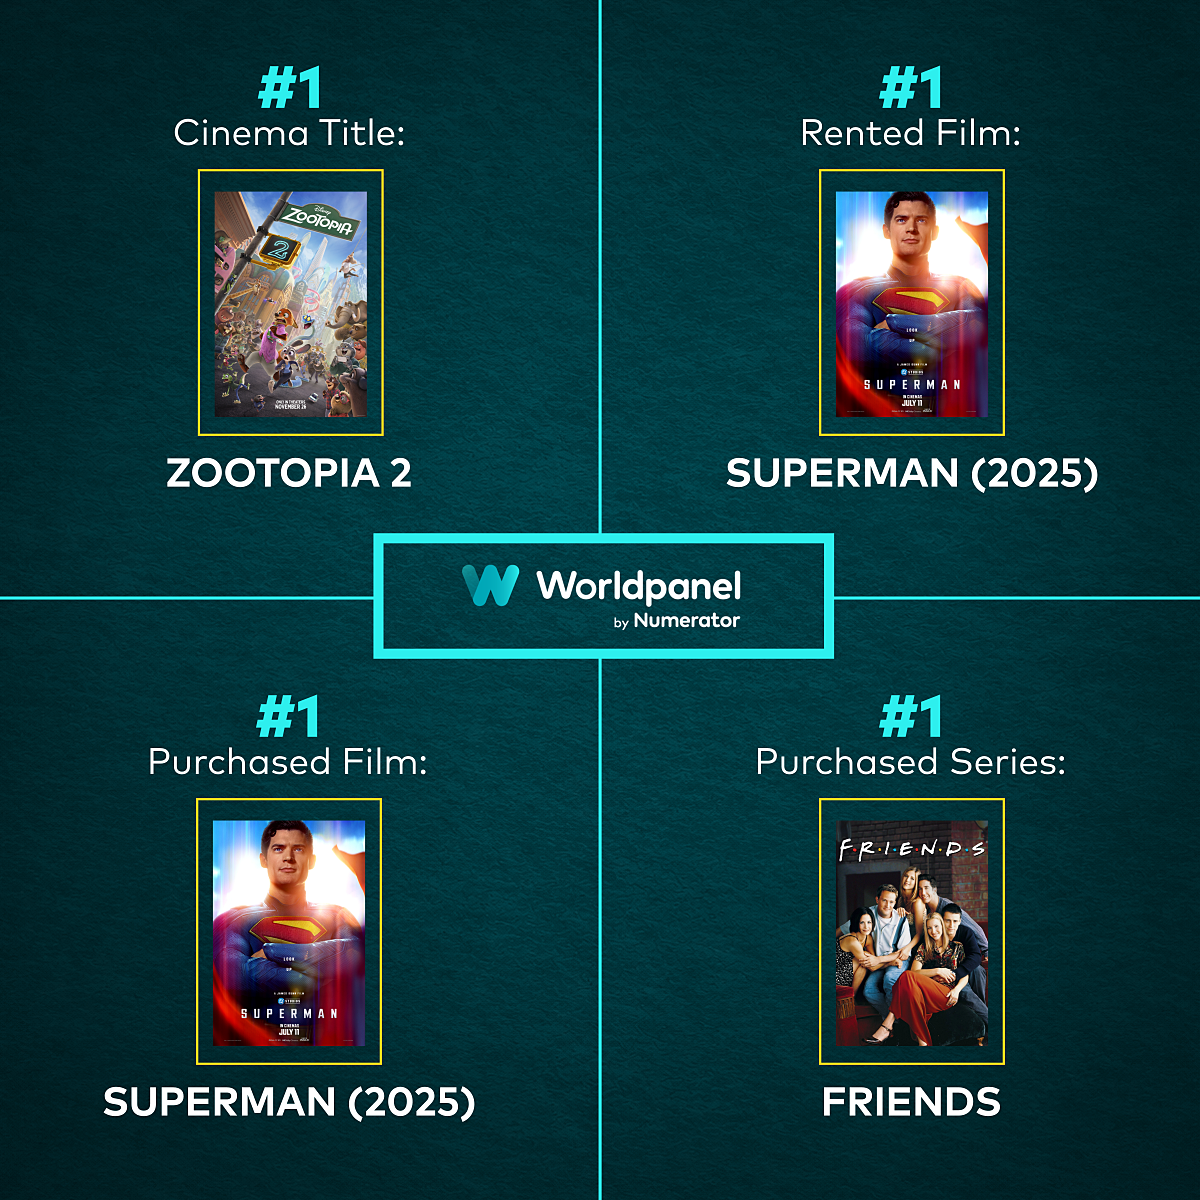
While younger audiences go to the movies more often, there is common ground across generations when it comes to what they watch. The top movie seen in theaters for all age groups under 55 was Zootopia 2. But for over 55s, musicals beat out the Disney animated film. Wicked: For Good was the top movie seen in theater for 55-64s and Song Sung Blue for ages 65+.
The lifetime value of a movie title goes beyond just the cinema. In the 6 m/e March’26, 9% of the US bought a digital movie, and 10% rented. At the same time that Zootopia 2 was dominating in theaters, the superhero genre was winning in the home. The #1 bought and rented movie in this time period was Superman, and the #2 purchased movie was The Batman.
Although Gen Z (under 25s) are more frequent movie-goers, keeping up with the blockbuster hits, their at-home spend leans more towards nostalgia. The trend of “nostalgia” has been evident across categories like fashion and technology, and it’s also evident in Gen Z’s spend on films. For example, Twilight, released in 2008, cracks the top 5 both rented and purchased titles among Gen Z. The popularity of the film quickly drops off for the 25–34-year-old age group. This behavior is undoubtedly influencing the production of film and television reboots and sequels in hopes of winning the Gen Z audience.
Within the television transactional category, sitcoms reign supreme. A similar search for nostalgia is evident in television series purchases. Friends was the top purchased series for all age groups under 55. And at a total US level, series like Seinfeld and The Office are still commonly purchased. As streaming has focused on producing dramas and limited-series, those looking for a long-running sitcom are looking to purchase older titles.
Discussions of trending TV titles often stick to streaming while overlooking the digital purchase of a series. But series purchases have the highest average spend per transaction compared to other transactional categories. Because viewers are often purchasing an entire season at once, series buyers claim to spend over $18 per transaction. Compare that to a film rental, which averages just $9.20 per transaction. In such a large market as the US, even a category that accounts for just 9% of transactional spend is still high value.
The transactional category has changed significantly in the last five years. Understanding how consumer groups spend in the transactional categories is key for gauging the lifetime value of a title. It can help plan what titles get greenlit, how long a theatrical release should be, and who should be the target audience both in and out of theaters. It impacts the go-to-market and marketing strategies. To learn more, inquire with the Entertainment on Demand team, or contact Jennifer Larkman
.jpg)


.svg)